

What you get
- Chat UI at
/, themeable, AG-UI streaming, three layout variants (branded / minimal / inspector). - Admin panel at
/admin/, edit agent config, guardrails, MCP servers, prompts, observability, integrations, and theme. Hot-reload of the running agent on save. - Dashboard at
/admin/, live activity stats sourced from the local trace store: request count, p50/p95 latency, error rate, total cost, traffic sparkline, top errors. - First-party traces at
/admin/traces/, every AG-UI run event captured locally; debug an agent without external observability. - Single Docker image, single Python process. SQLite by default; Postgres for production.
When to use it
- You ship ONE agent and don’t need the governance hub.
- You want to iterate on an agent locally with the full Idun stack — not just the engine SDK.
- You want a branded chat UI without writing a frontend.
When NOT to use it
- You have your own admin stack and only want the runtime layer. Use engine-only mode with
idun agent serve --source file --path config.yamlinstead. - You’re running multiple agents per host. Standalone is single-agent, single-tenant; run one process per agent.
Architecture in 60 seconds
The standalone wrapsidun-agent-engine in a single FastAPI process. The engine still runs the agent and serves /agent/run. The standalone adds the chat UI, the admin REST surface, the trace store, password auth, and a hot-reload pipeline that rebuilds the engine on every admin write.
Spans flow into standalone_trace + standalone_span tables via an OTel exporter the standalone attaches at boot, and the admin UI reads them back through the same REST surface.
Dashboard
The admin panel opens on a dashboard sourced from the trace store. It refreshes every time you reload and gives you a single-pane view of whether the agent is healthy.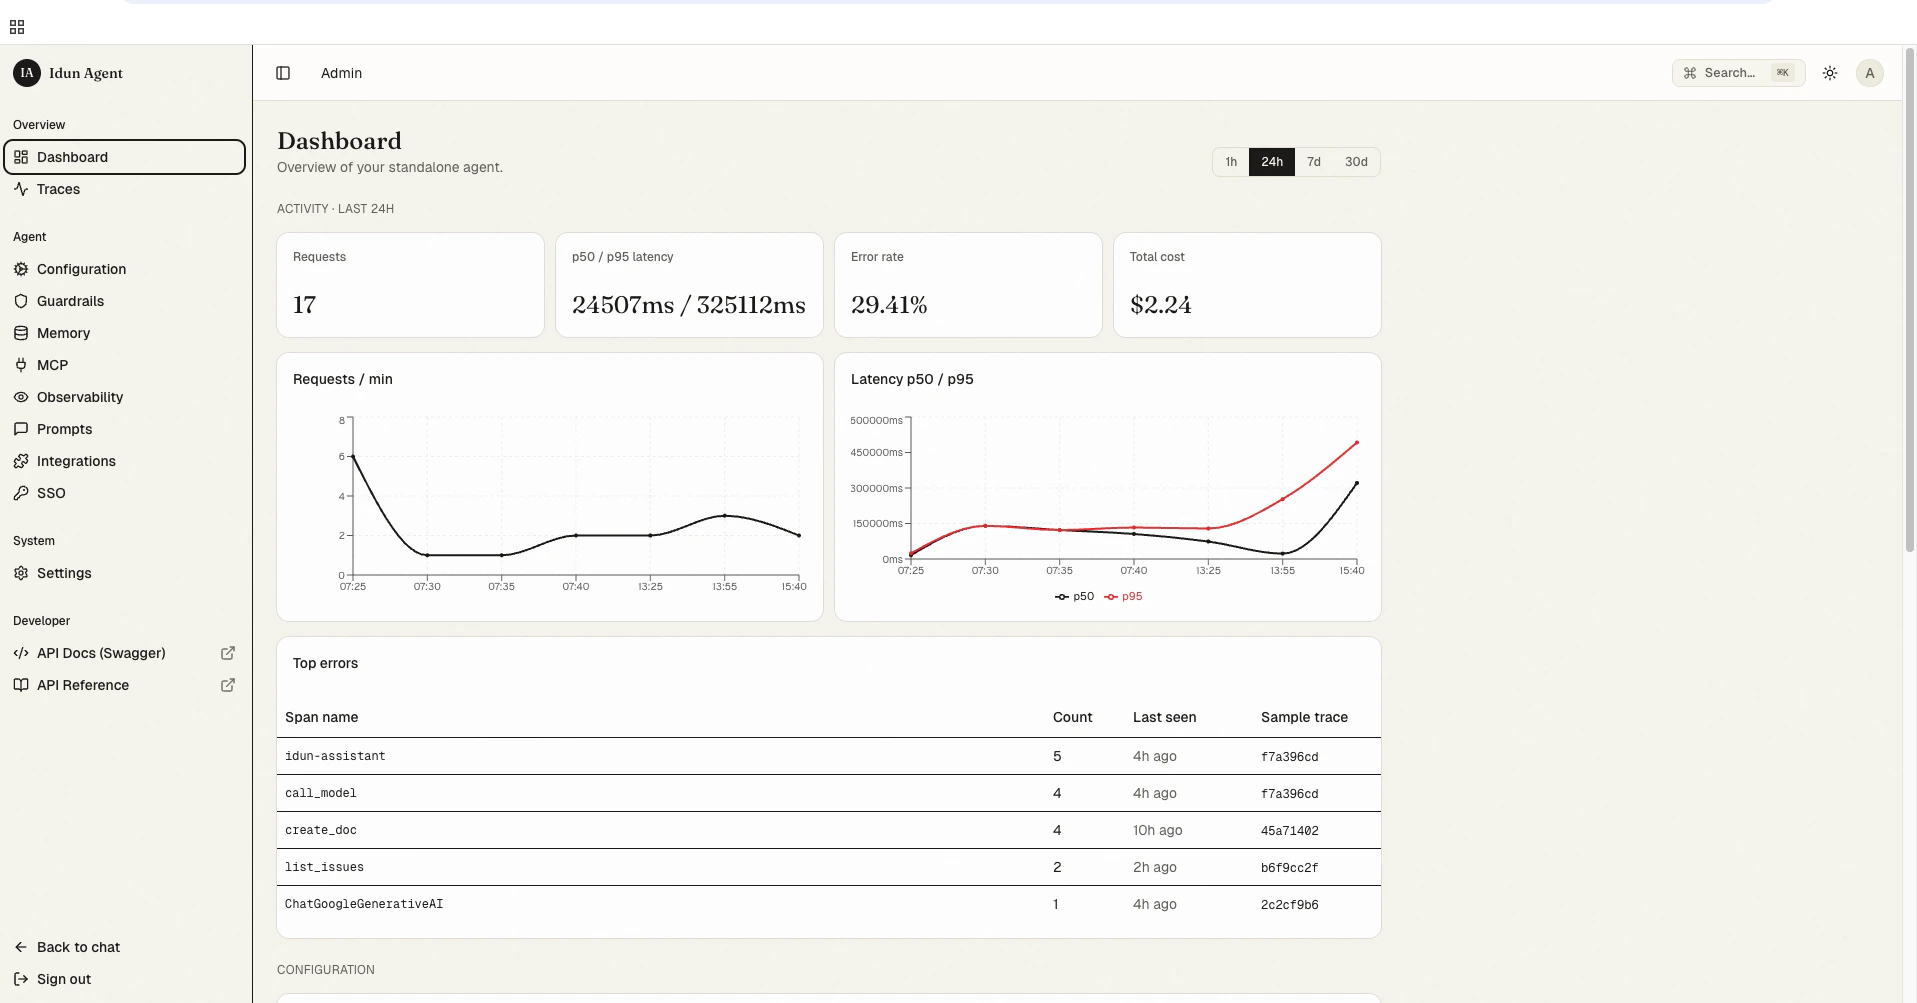
- Activity (24h / 7d / 30d toggle): total requests, p50/p95 latency, error rate, total cost across the window.
- Requests / min: a sparkline of traffic over the window. Spikes here pair with spikes in the latency chart so you can spot saturation.
- Latency p50 / p95: two-line chart over the window.
- Top errors: a leaderboard of failing span names with a count, last-seen timestamp, and a one-click link into the offending trace.
standalone_trace + standalone_span directly. No external observability provider needed.
Next steps
Quickstart
Get the standalone running locally with your first agent.
Admin panel and reload pipeline
How saves validate, hot-reload, and roll back without a process restart.
CLI reference
Every flag of
idun and the supporting commands.Cloud Run deployment
Deploy the standalone to Google Cloud Run.
Customizing the UI
Theme the chat UI and pick a layout variant.