

Set up Phoenix observability
1
Get your Phoenix details
- Phoenix Cloud
- Self-hosted
- Go to Arize Phoenix
- Sign up or log in to your account
- Create a new project or select an existing one
- Note your Project Name and the Collector Endpoint (typically
https://collector.phoenix.com)
2
Configure Phoenix in the standalone
Open the running standalone at 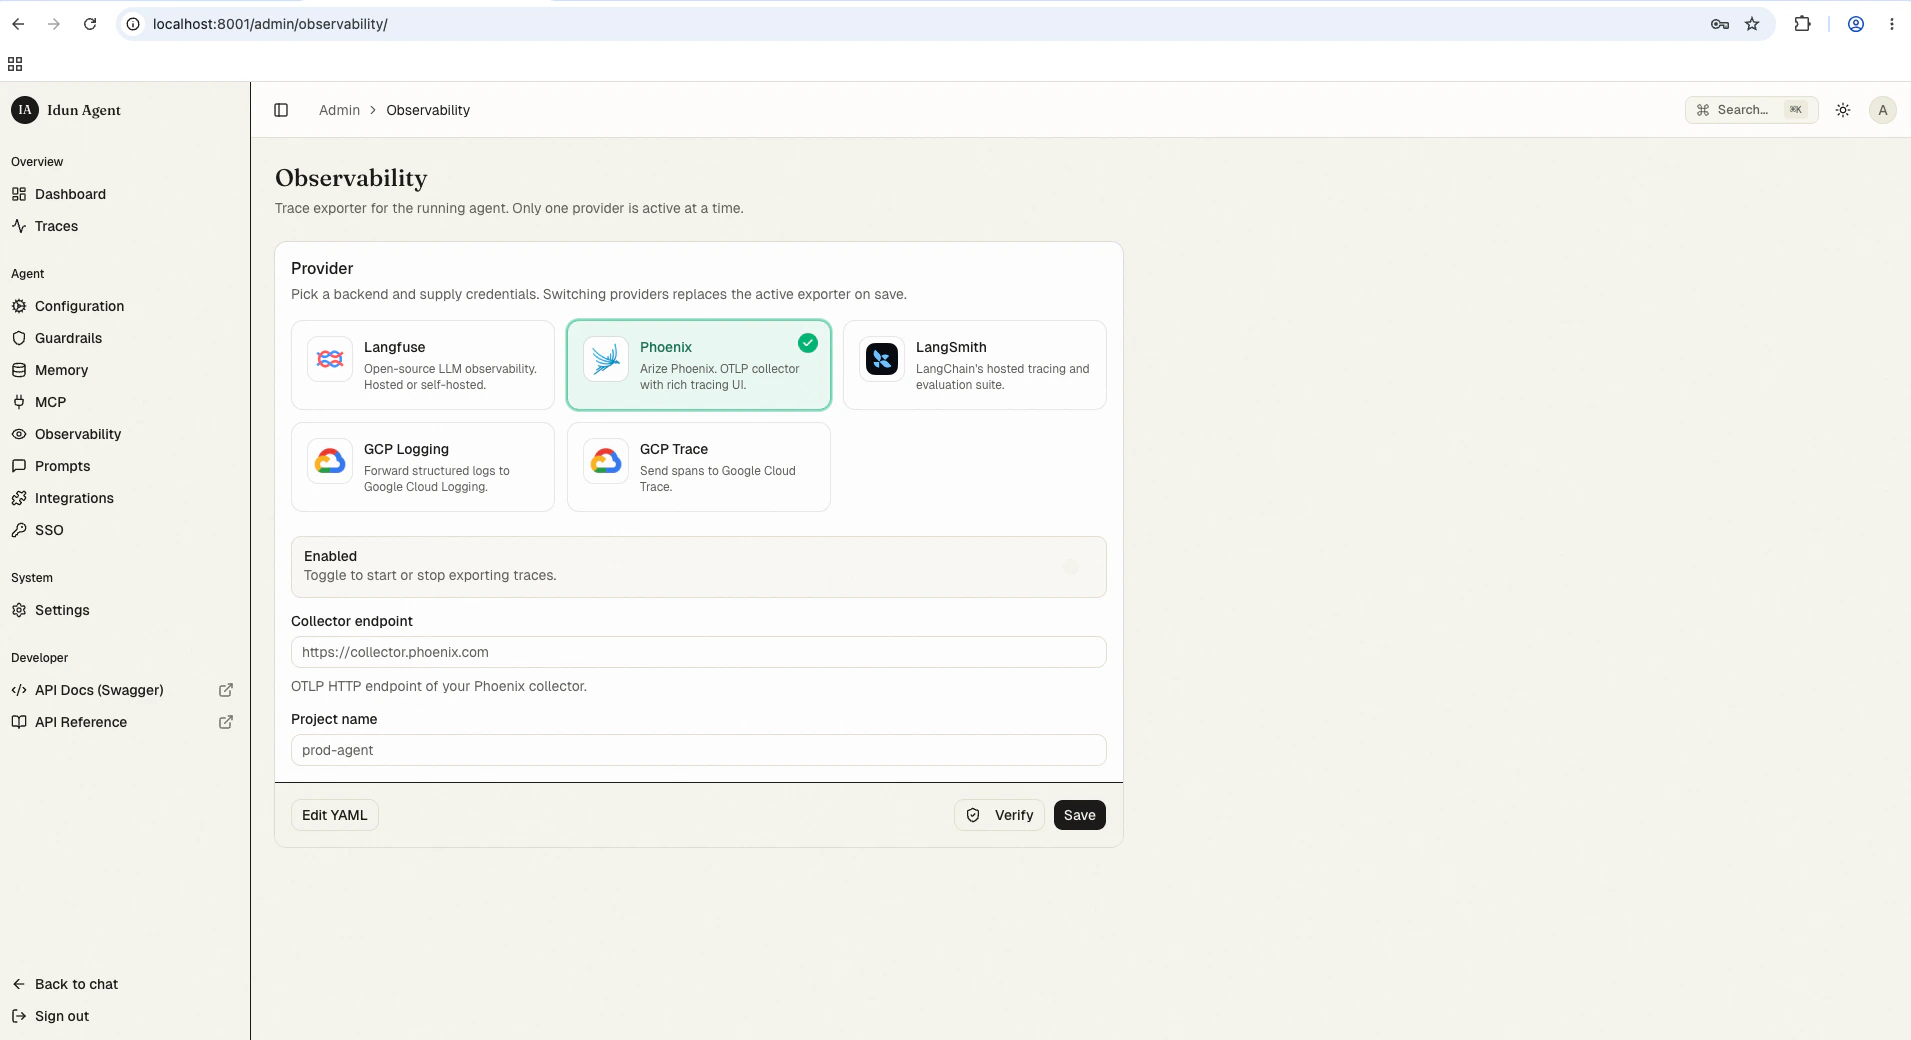
/admin/observability/ and click Phoenix. Fill in:- Collector endpoint: URL of the Phoenix collector (e.g.,
https://collector.phoenix.comor your self-hosted URL) - Project name: The project in Phoenix to bucket these traces under
config.yaml for first-boot seeding or engine-only mode:
config.yaml
View observability data
Once your agent is running with observability enabled:- Interact with your agent through the chat UI at
/or the API at/agent/run - Open your Phoenix dashboard
- Navigate to your project to view traces
Best practices
- Use descriptive names for observability configurations
- Monitor latency using Phoenix’s performance tools
- Check traces regularly to understand agent behavior
Troubleshooting
Observability not working?
Observability not working?
- Check collector endpoint: Verify the URL is correct and accessible from the agent environment
- Verify project name: Confirm it matches the project name in Phoenix exactly
- Check network: Confirm your agent environment can reach the Phoenix collector
Next steps
Local trace store
See the same agent runs in the bundled admin UI without extra config.
Observability overview
Compare built-in providers and their configuration shapes.
Custom handler
Wire a different OTel-compatible backend through Pattern B.