

config.yaml, and the engine fans spans out to local storage and every enabled provider.
Supported providers
How it works
When you attach an observability configuration to an agent, the platform automatically instruments the agent runtime. Depending on the provider, you get:- Traces showing agent execution flow, LLM calls, and tool invocations
- Latency metrics for each step in the agent graph
- Cost tracking based on token usage
- Error traces with full context for debugging
- Structured logs for centralized log analysis
Configuration
- Config file
- Admin UI
Add an The
observability section to your config.yaml with the provider and its credentials:config.yaml
observability key is a list, and you can attach more than one provider at a time; each entry is lazy-loaded and the engine fans spans out to every enabled provider. See the provider-specific pages for the full list of fields each provider requires.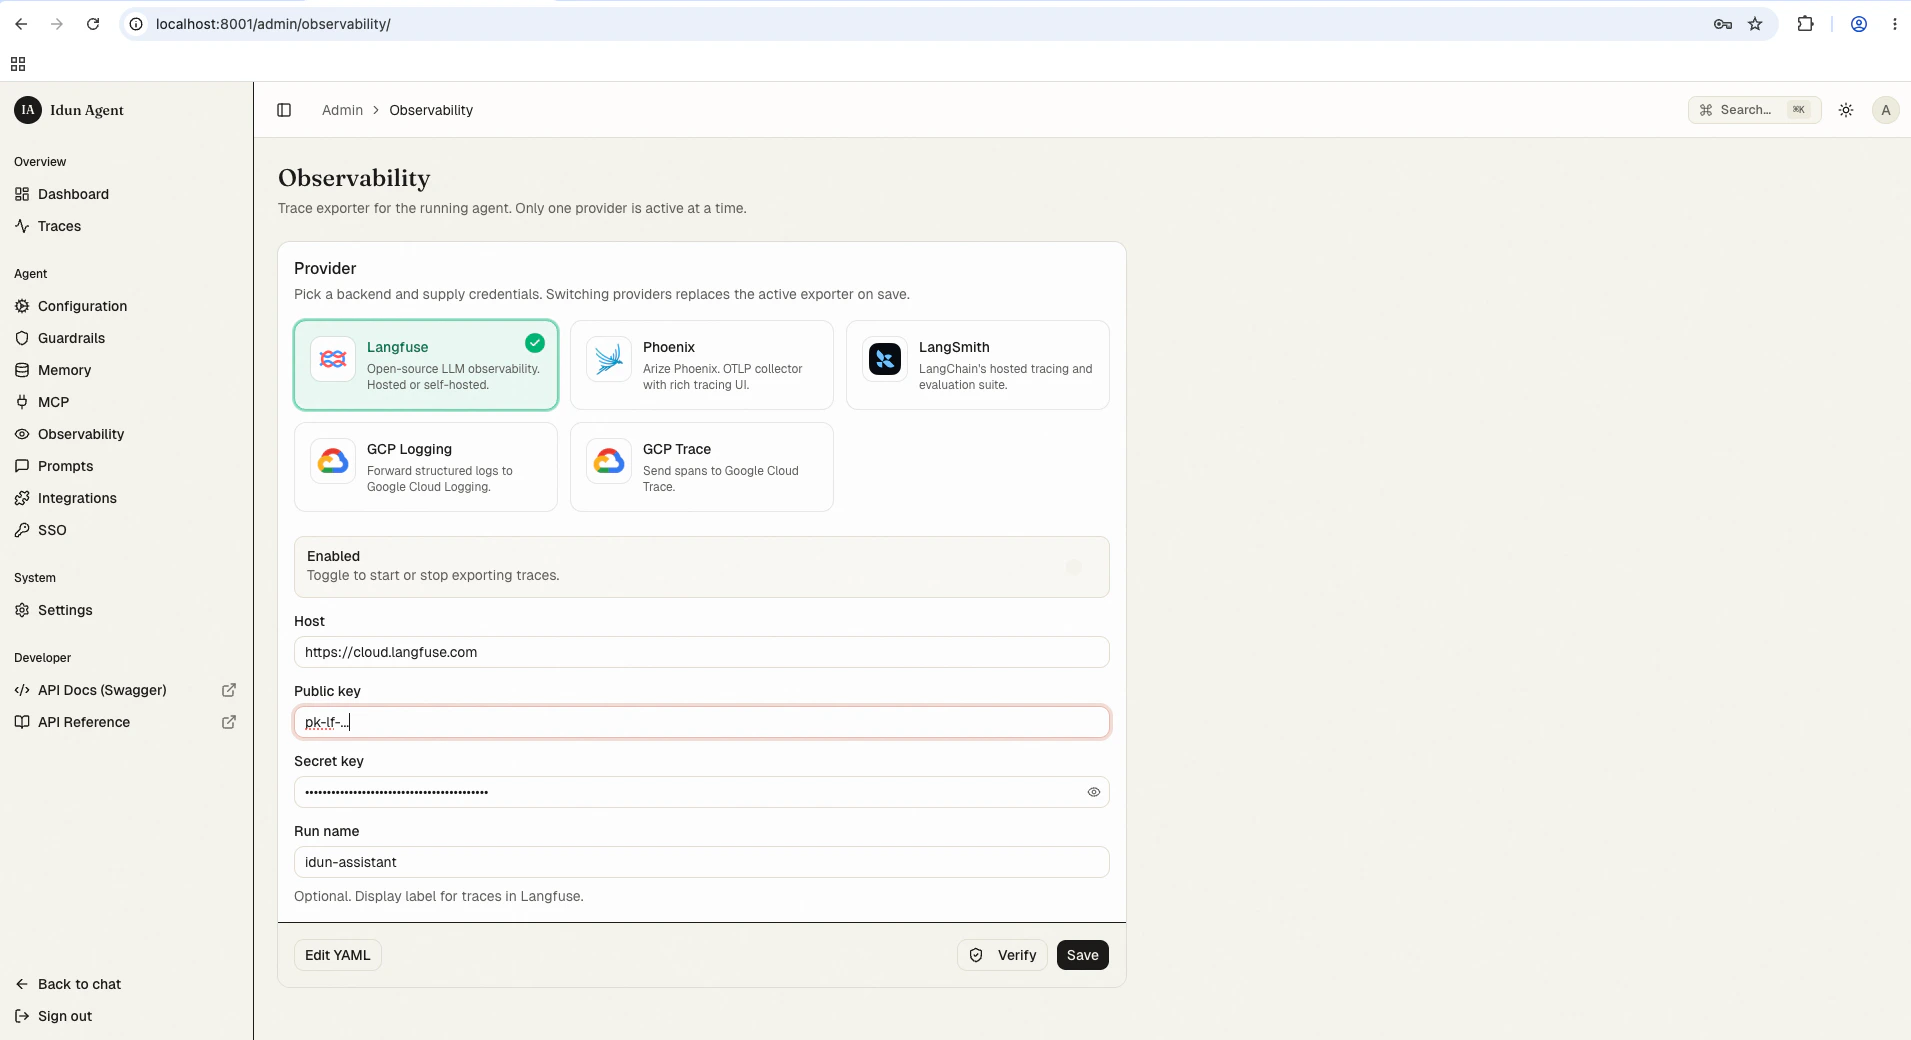
Probing the connection programmatically
The configured observability provider can be smoke-tested without going through the admin UI.POST /admin/api/v1/observability/check-connection runs the same probe the admin Test-connection button uses and returns a StandaloneConnectionCheck:
>= 400) against their configured endpoint; success means an HTTP status under 500:
ok: true with a details.note flagging that the runtime auth check needs GCP credentials and was not attempted; the probe only validates that project_id is set:
ok reflecting reachability, runs under a 5-second timeout, and never raises (services/connection_checks.py).
The route is admin-authenticated: under IDUN_ADMIN_AUTH_MODE=password you need the session cookie minted by POST /admin/api/v1/auth/login. Use this in pre-deploy gates to confirm credentials still resolve before flipping traffic.
Next steps
Local traces
Browse, search, and inspect AG-UI run events captured by the standalone’s trace store.
Telemetry events
The OpenTelemetry event shape the engine emits.
Custom handler
Wire your own span handler when the built-in providers don’t fit.