

Set up Langfuse observability
1
Get your Langfuse API keys
If you do not have Langfuse API keys yet:
- Go to Langfuse Cloud or your self-hosted instance
- Sign up or log in to your account
- Create a new project or select an existing one
- Navigate to Settings > API Keys
- Click Create New API Key
- Copy the Public Key and Secret Key
2
Configure Langfuse in the standalone
Open the running standalone at 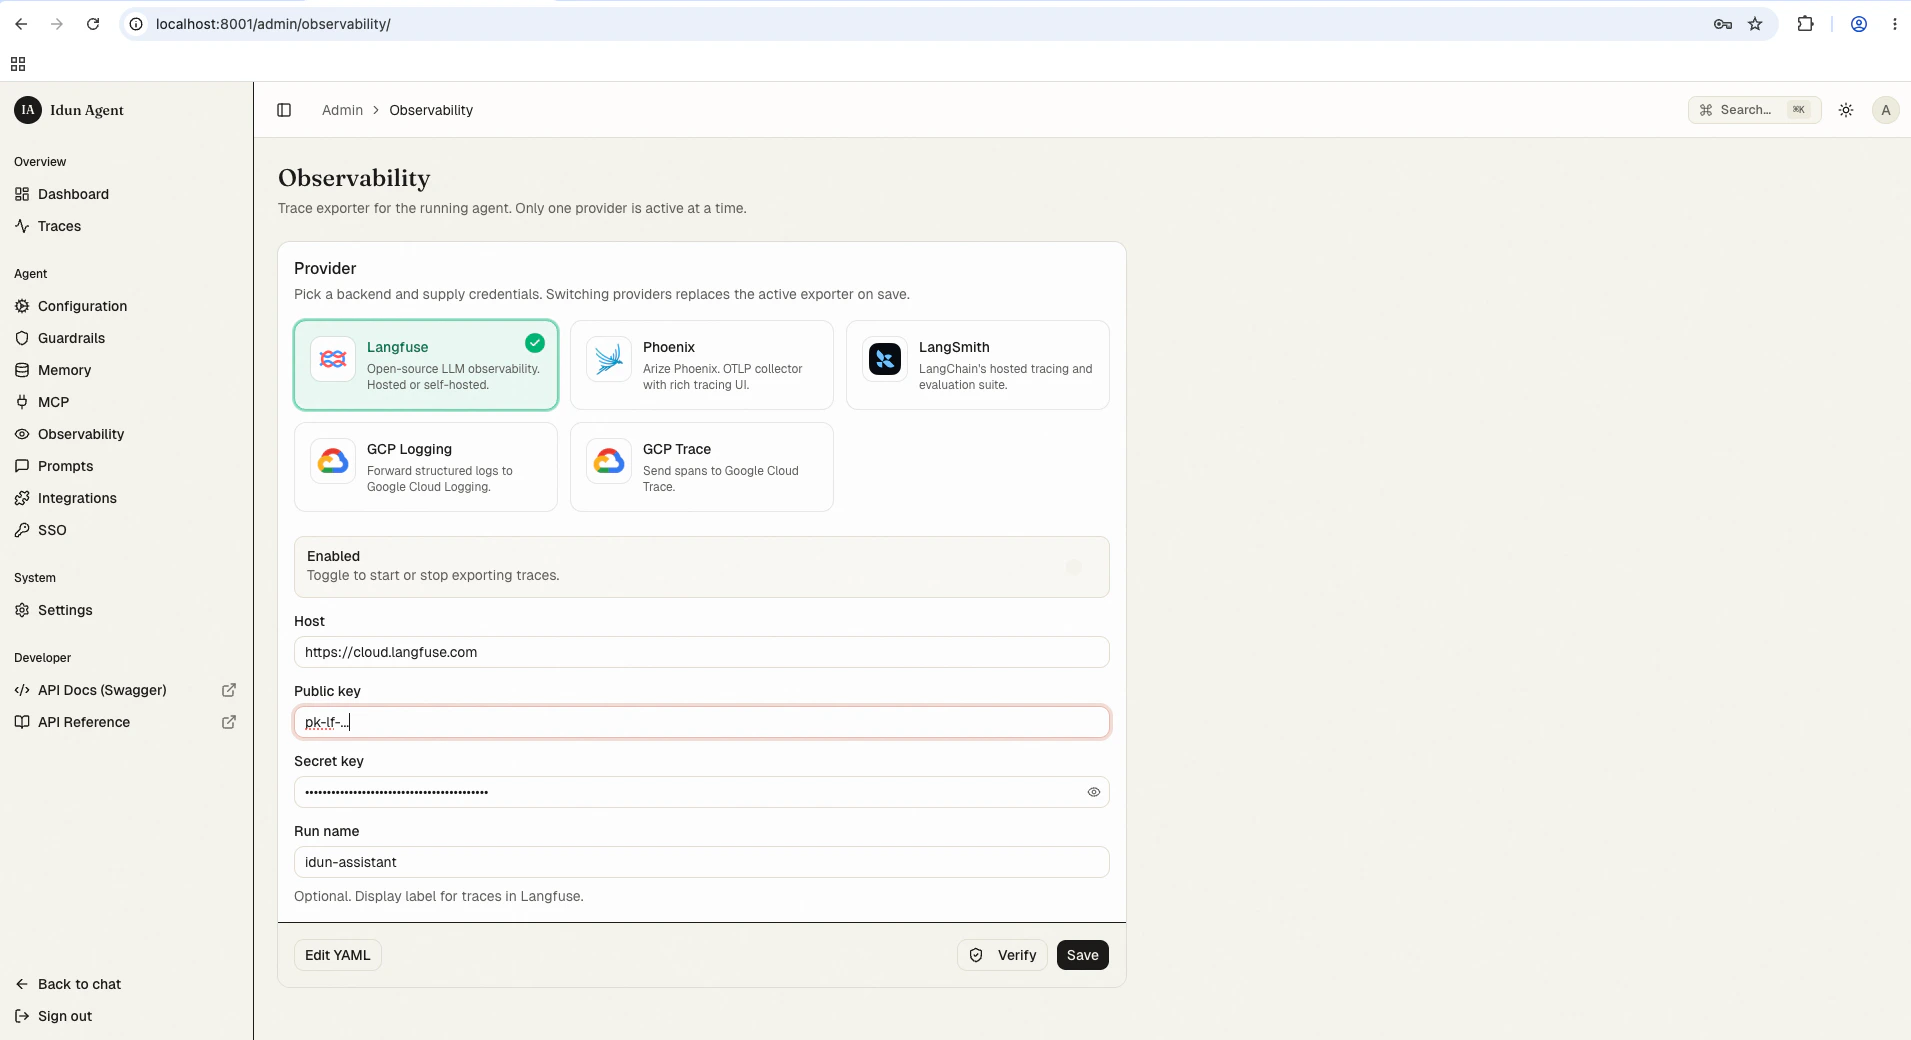
/admin/observability/ and click Langfuse. Fill in:- Host: Your Langfuse instance URL (e.g.,
https://cloud.langfuse.comor your self-hosted URL) - Public key: Langfuse public key (starts with
pk-lf-...) - Secret key: Langfuse secret key (starts with
sk-lf-...) - Run name: (Optional) Display label for traces in Langfuse (e.g.,
my-agent)
config.yaml for first-boot seeding or engine-only mode:
config.yaml
View observability data
Once your agent is running with observability enabled:- Interact with your agent through the chat UI at
/or the API at/agent/run - Open your Langfuse dashboard at cloud.langfuse.com
- Navigate to your project to view traces
- Agent execution flow
- LLM calls and responses
- Tool usage and results
- Execution time and costs
- Error traces and debugging information
Best practices
- Use descriptive names for observability configurations to identify them when managing multiple agents
- Enable observability during development to catch issues early
- Monitor costs through your Langfuse dashboard to track token usage
Troubleshooting
Observability not working?
Observability not working?
- Check API keys: Verify that your public and secret keys are correct
- Verify host URL: Confirm the URL is accessible and correctly formatted
- Check agent logs: Look for connection errors in the agent runtime logs
- Test connectivity: Verify your agent can reach the Langfuse host
Next steps
Local trace store
Inspect every agent run in the bundled admin UI alongside Langfuse.
Observability overview
Compare built-in providers and their configuration shapes.
Custom handler
Write a handler for any provider not on the shipping list.