

Set up LangSmith observability
1
Get your LangSmith API key
If you do not have a LangSmith API key yet:
- Go to LangSmith
- Sign up or log in to your account
- Navigate to Settings (gear icon) > API Keys
- Click Create API Key
- Copy your API Key
2
Configure LangSmith in the standalone
Open the running standalone at 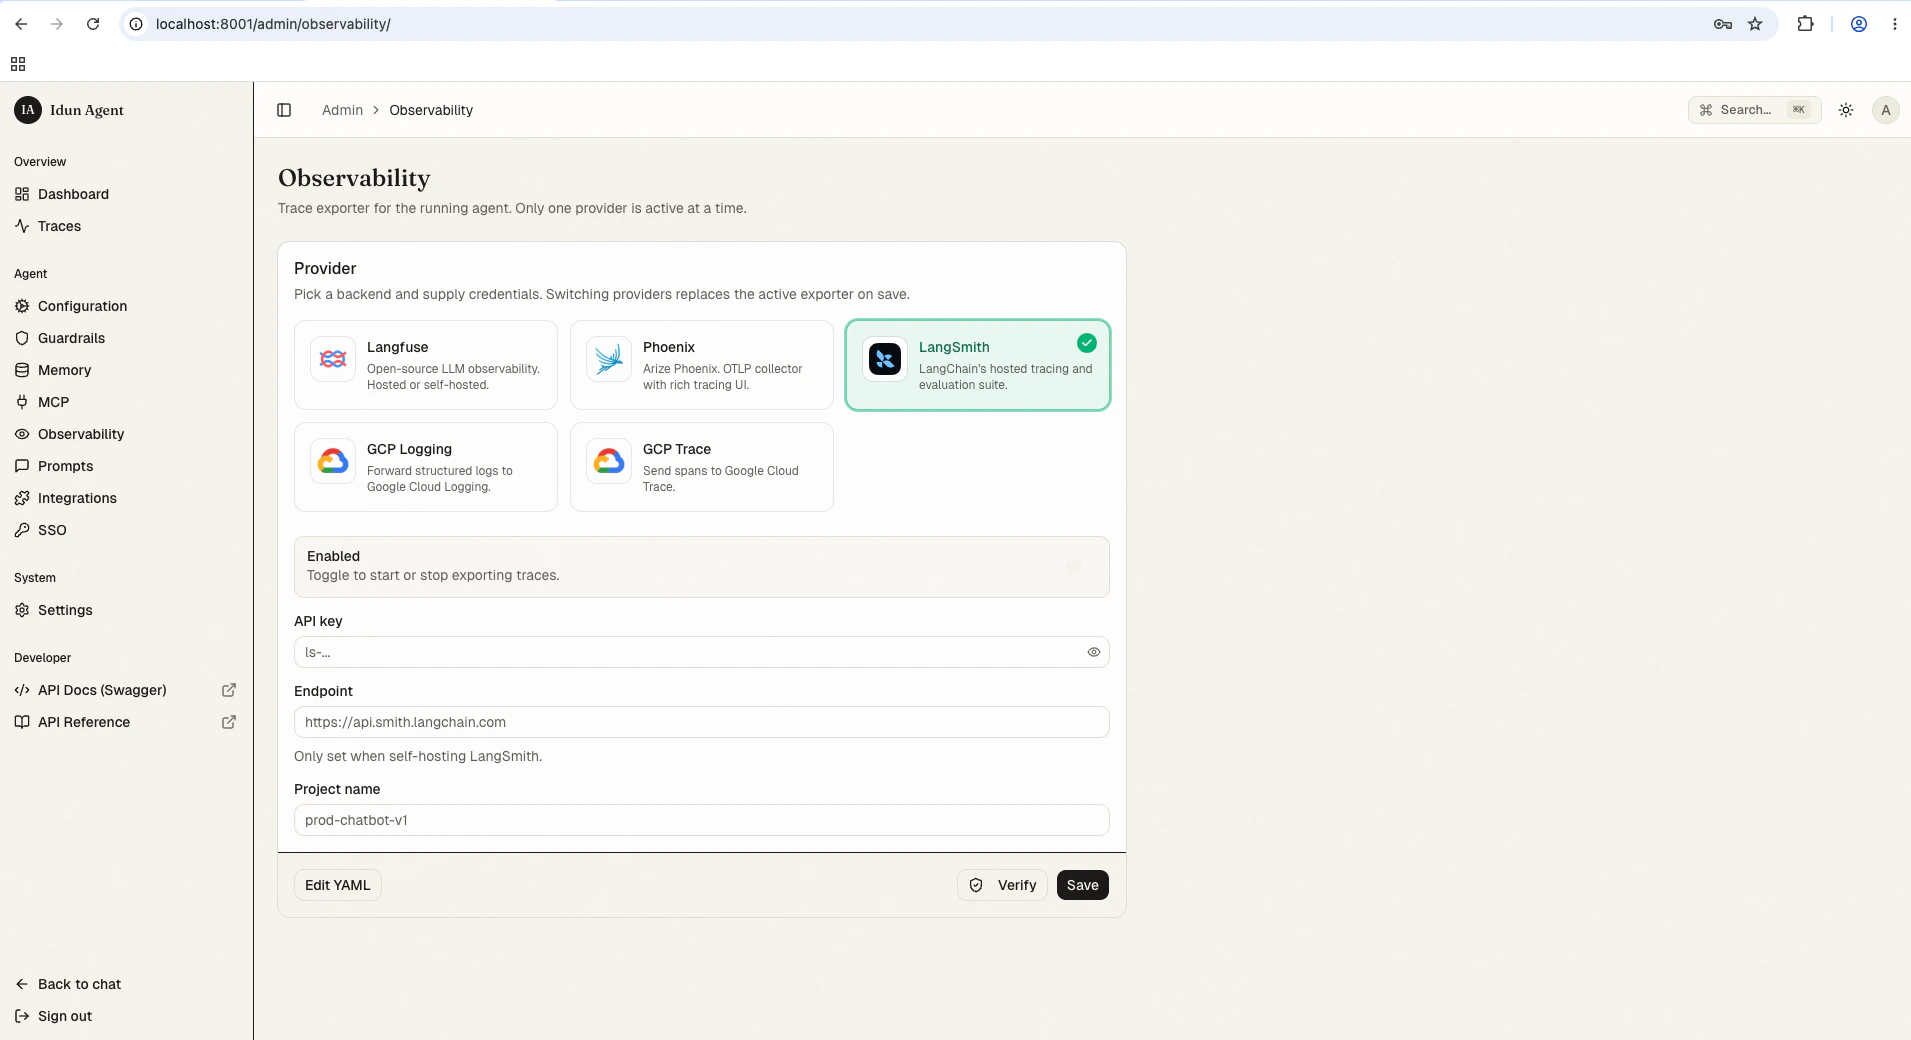
/admin/observability/ and click LangSmith. Fill in:- API Key: Your LangSmith API key (starts with
lsv2-...) - Project Name: The name of the project in LangSmith (for example,
defaultorprod-agent) - Endpoint: (Optional) Custom endpoint if you are self-hosting LangSmith (defaults to
https://api.smith.langchain.com) - Run Name: (Optional) Display name for each trace run in LangSmith (for example,
my-agent)
config.yaml for first-boot seeding or engine-only mode:
config.yaml
View observability data
Once your agent is running with observability enabled:- Interact with your agent through the chat UI at
/or the API at/agent/run - Open your LangSmith dashboard at smith.langchain.com
- Navigate to your project to view traces
Best practices
- Use distinct projects for development and production environments
- Tag runs to filter traces when investigating specific issues (configured within agent logic)
- Review error traces in LangSmith to identify and resolve problems quickly
Troubleshooting
Observability not working?
Observability not working?
- Check API key: Verify it is valid and has the required permissions
- Verify project name: Traces are sent to the “default” project if the project name is not specified or is incorrect
- Check tracing toggle: Confirm the tracing toggle is enabled in the configuration
Next steps
Local trace store
Inspect every agent run in the bundled admin UI alongside LangSmith.
Observability overview
Compare built-in providers and their configuration shapes.
Custom handler
Write a handler for any provider not on the shipping list.